Understanding the machine learning process can seem challenging, but it’s essential knowledge in today’s highly competitive world.


In the case of machine learning, breaking the process into clear steps makes it easier to follow and understand. Machine learning (ML) might sound challenging, but the reality is that it’s built on logical stages.
How complex it is aside - the industry is expected to grow to at least 30.16 billion USD in 2025 in the US alone! This means getting familiar as early on as possible can be a smart move that really pays off. Here’s how the process works:
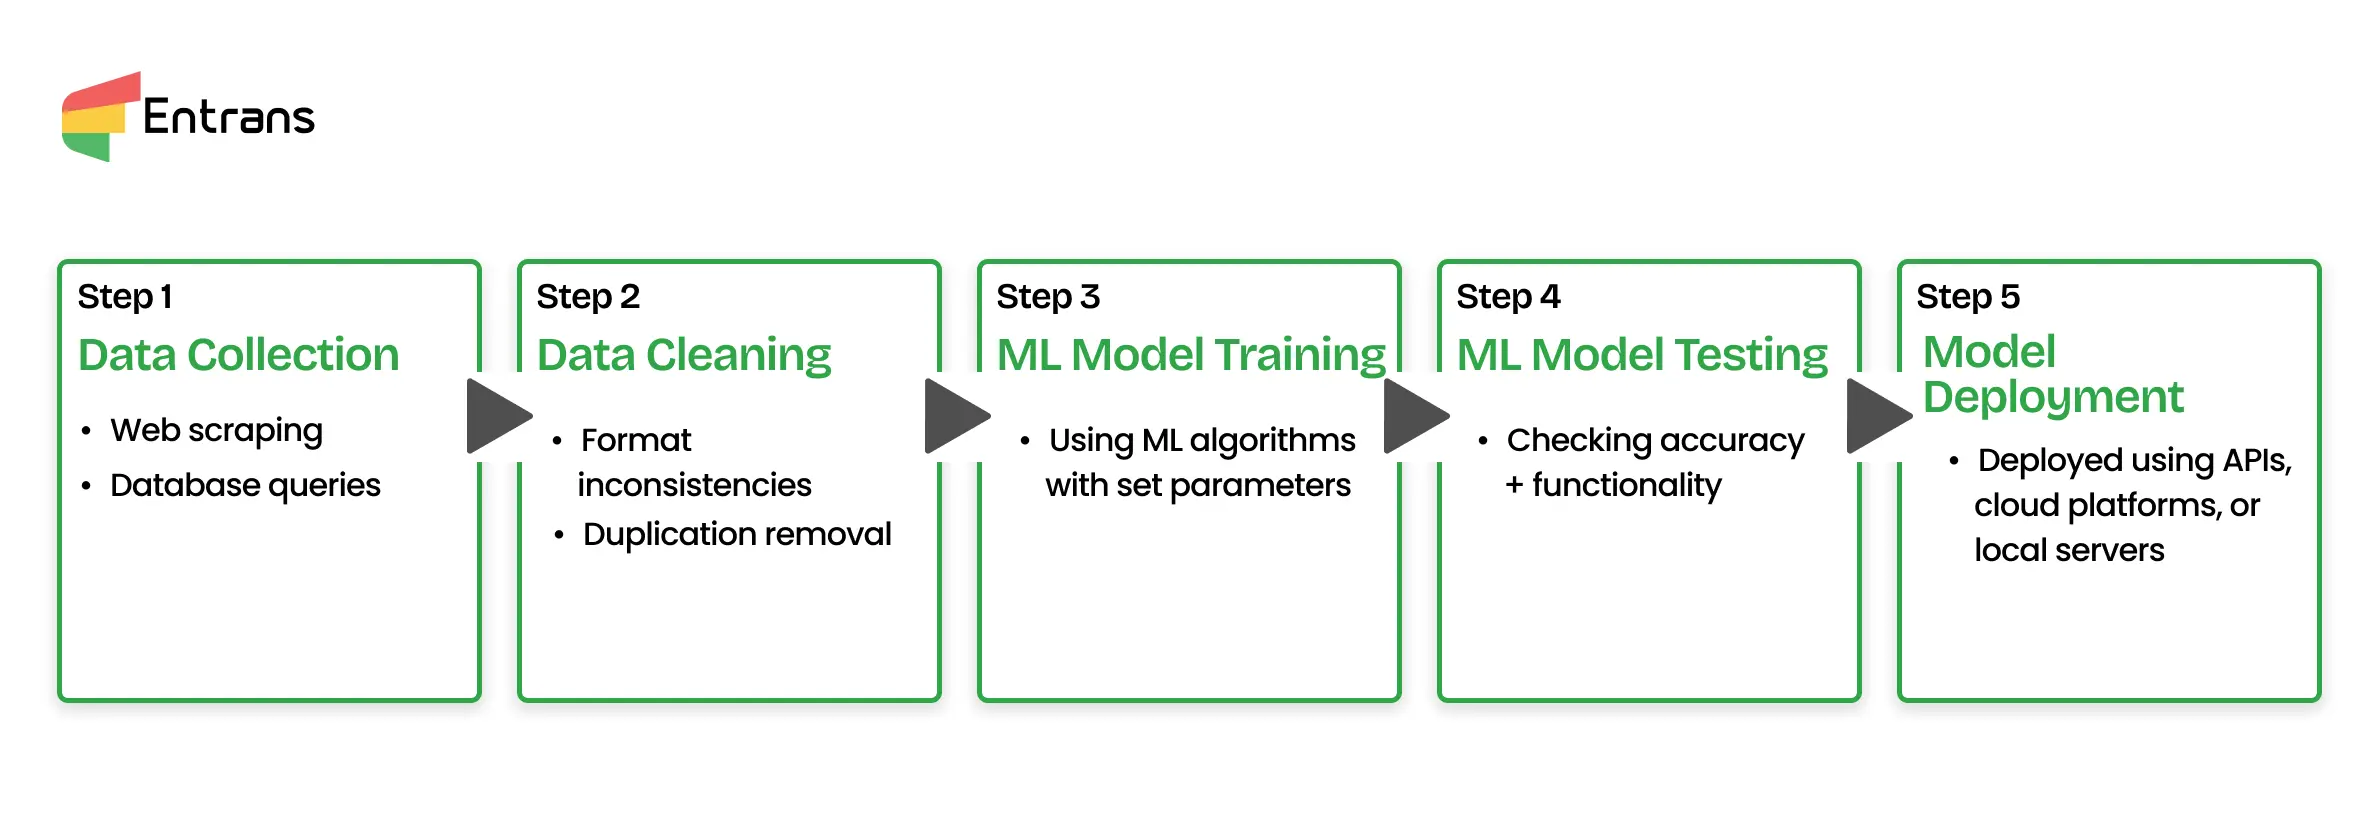
The first step in the machine learning process, data collection, is important for developing accurate models. This step of the process involves gathering diverse and relevant datasets from structured and unstructured sources, allowing coverage of major variables.
In this step, machine learning companies use techniques like web scraping, API usage, and database queries are employed to retrieve data efficiently while maintaining quality and validity.
While there are several stages in the machine learning process, one major aspect of data cleaning is its focus on refining raw datasets for improved accuracy. This involves handling missing values, removing outliers, and addressing inconsistencies in formats or labels.
Additionally, techniques like normalization and feature scaling optimize data for algorithms, reducing potential biases.
With methods such as automated anomaly detection and duplication removal, data cleaning enhances model performance.
Training involves teaching the model to find patterns and relationships in the data. This step in the machine learning process uses algorithms and mathematical processes to help the model “learn” from examples. It’s where the real magic begins in machine learning.
Testing checks how well the model performs on new data. This step in machine learning is like a dress rehearsal, making sure that the model is ready for real-world use. It helps uncover errors and see how accurate the model is before deployment.
Deployment is the final step the machine learning process, where the model moves from testing to real-world applications. It starts making predictions or decisions based on new data. This step in machine learning connects the model to users or systems that rely on its outputs.
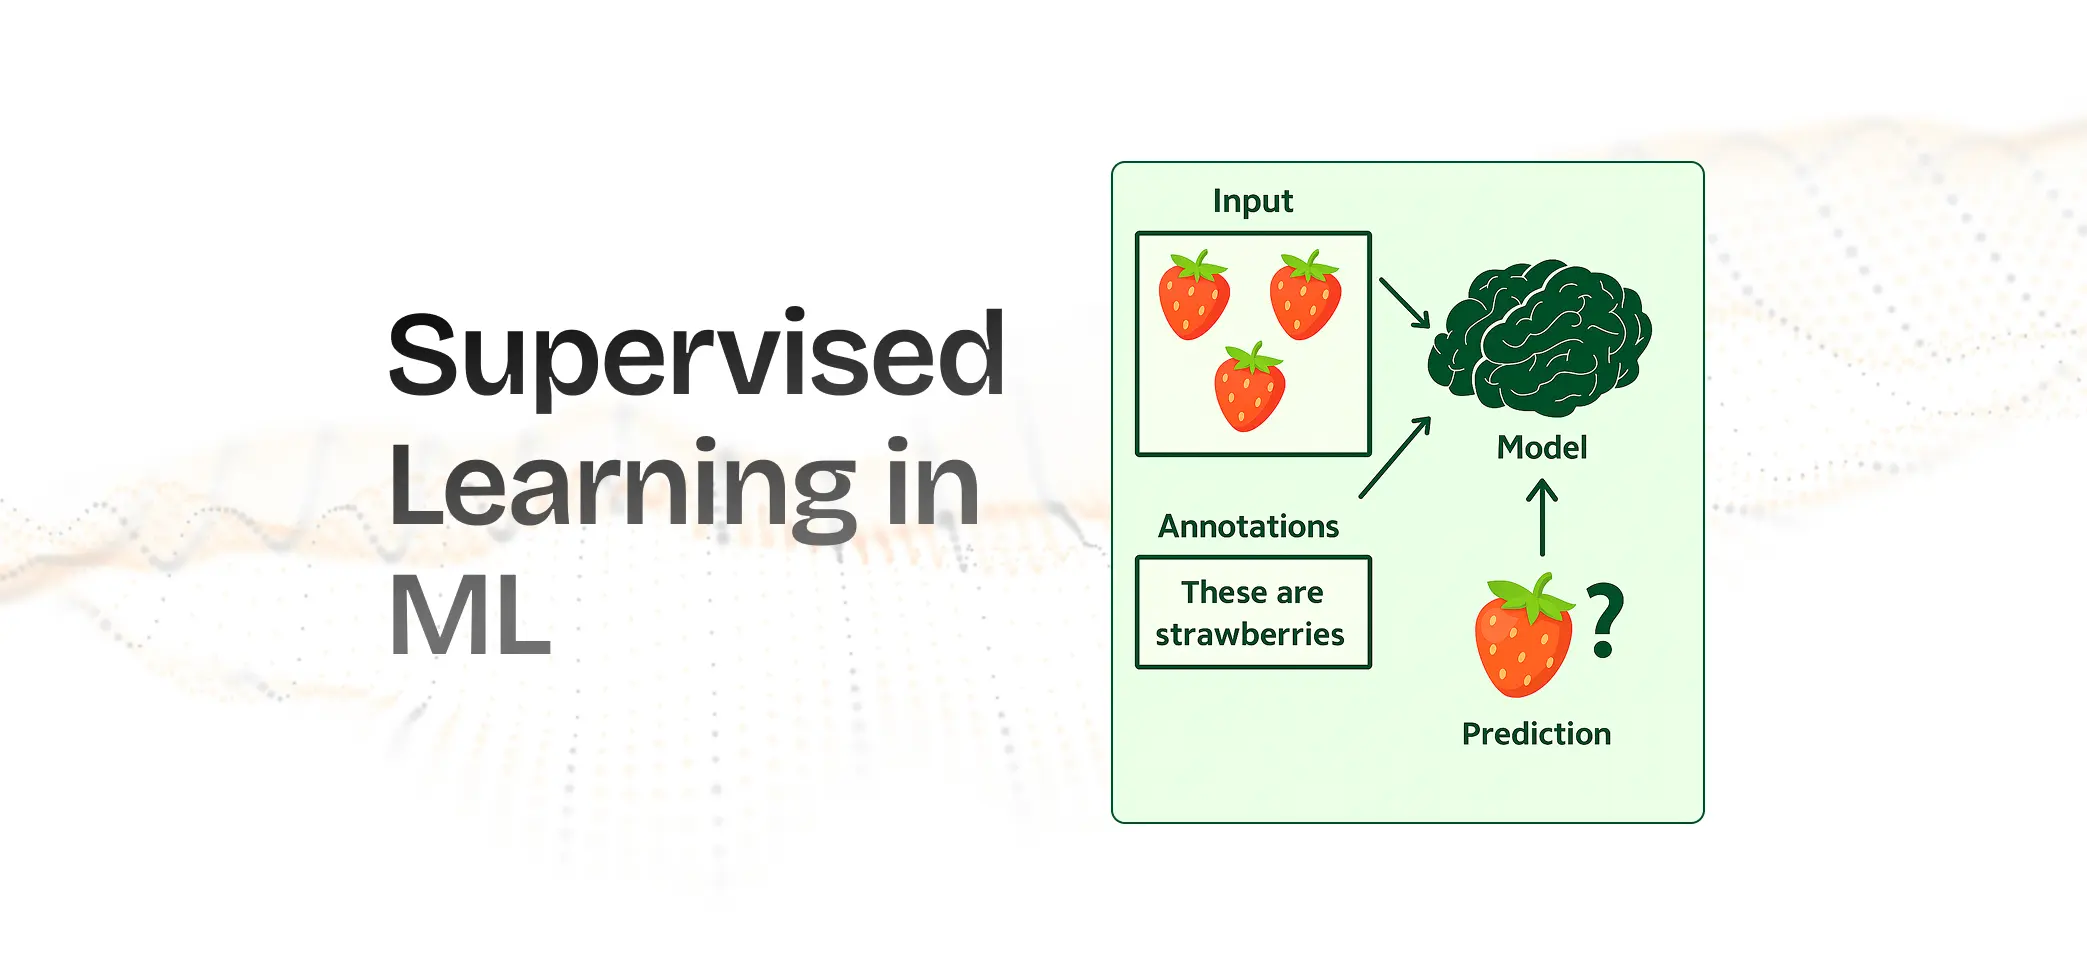
Logistic regression is often used for binary classification tasks, like predicting whether an email is spam. This type of ML algorithm works best when the relationship between the input and output variables is linear.
To get accurate results, scale the input data and avoid having highly correlated predictors. FICO uses this type of machine learning for financial prediction to calculate the likelihood of defaults.
The K-Nearest Neighbors (KNN) algorithm is great for classification problems with smaller datasets and non-linear class boundaries.
What this model does is compare new data points to the closest neighbors in the training set. For this, choosing the right number of neighbors (K) and the distance metric is essential to success in your machine learning process. Spotify uses this ML algorithm to give you music recommendations in their ‘ people also like’ feature.
Linear regression is widely used for predicting continuous values, such as housing prices.
This works well when variables have a linear relationship and the data is free of outliers. Checking for assumptions like consistent variance and normality of errors can improve accuracy in your machine learning model.
Random forest is a flexible algorithm that handles both classification and regression. This type of ML algorithm in your machine learning process works well when features are independent and data is categorical.
This makes sure the data matches the algorithm’s assumptions and improves results. PayPal uses this type of ML algorithm to detect fraudulent transactions.
Decision trees are easy to understand and visualize, making them great for explaining results. However, they may overfit without proper pruning. Choosing the maximum depth and appropriate split criteria is essential.
Naive Bayes is helpful for text classification problems, like sentiment analysis or spam detection.
This can be useful in your machine learning process when features are independent and the data is categorical. While using Naive Bayes, you need to make sure that your data aligns with the algorithm’s assumptions to achieve accurate results.
One helpful example of this is how Gmail calculates the probability of whether an email is spam.
Polynomial regression is ideal for modeling non-linear relationships. This fits a curve to the data instead of a straight line.
Choosing the right degree for the polynomial avoids overfitting and keeps the model meaningful. While using this method, avoid overfitting by selecting an appropriate degree for the polynomial.
A lot of companies like Apple use calculations the calculate the sales trajectory of a new product that has a nonlinear curve.
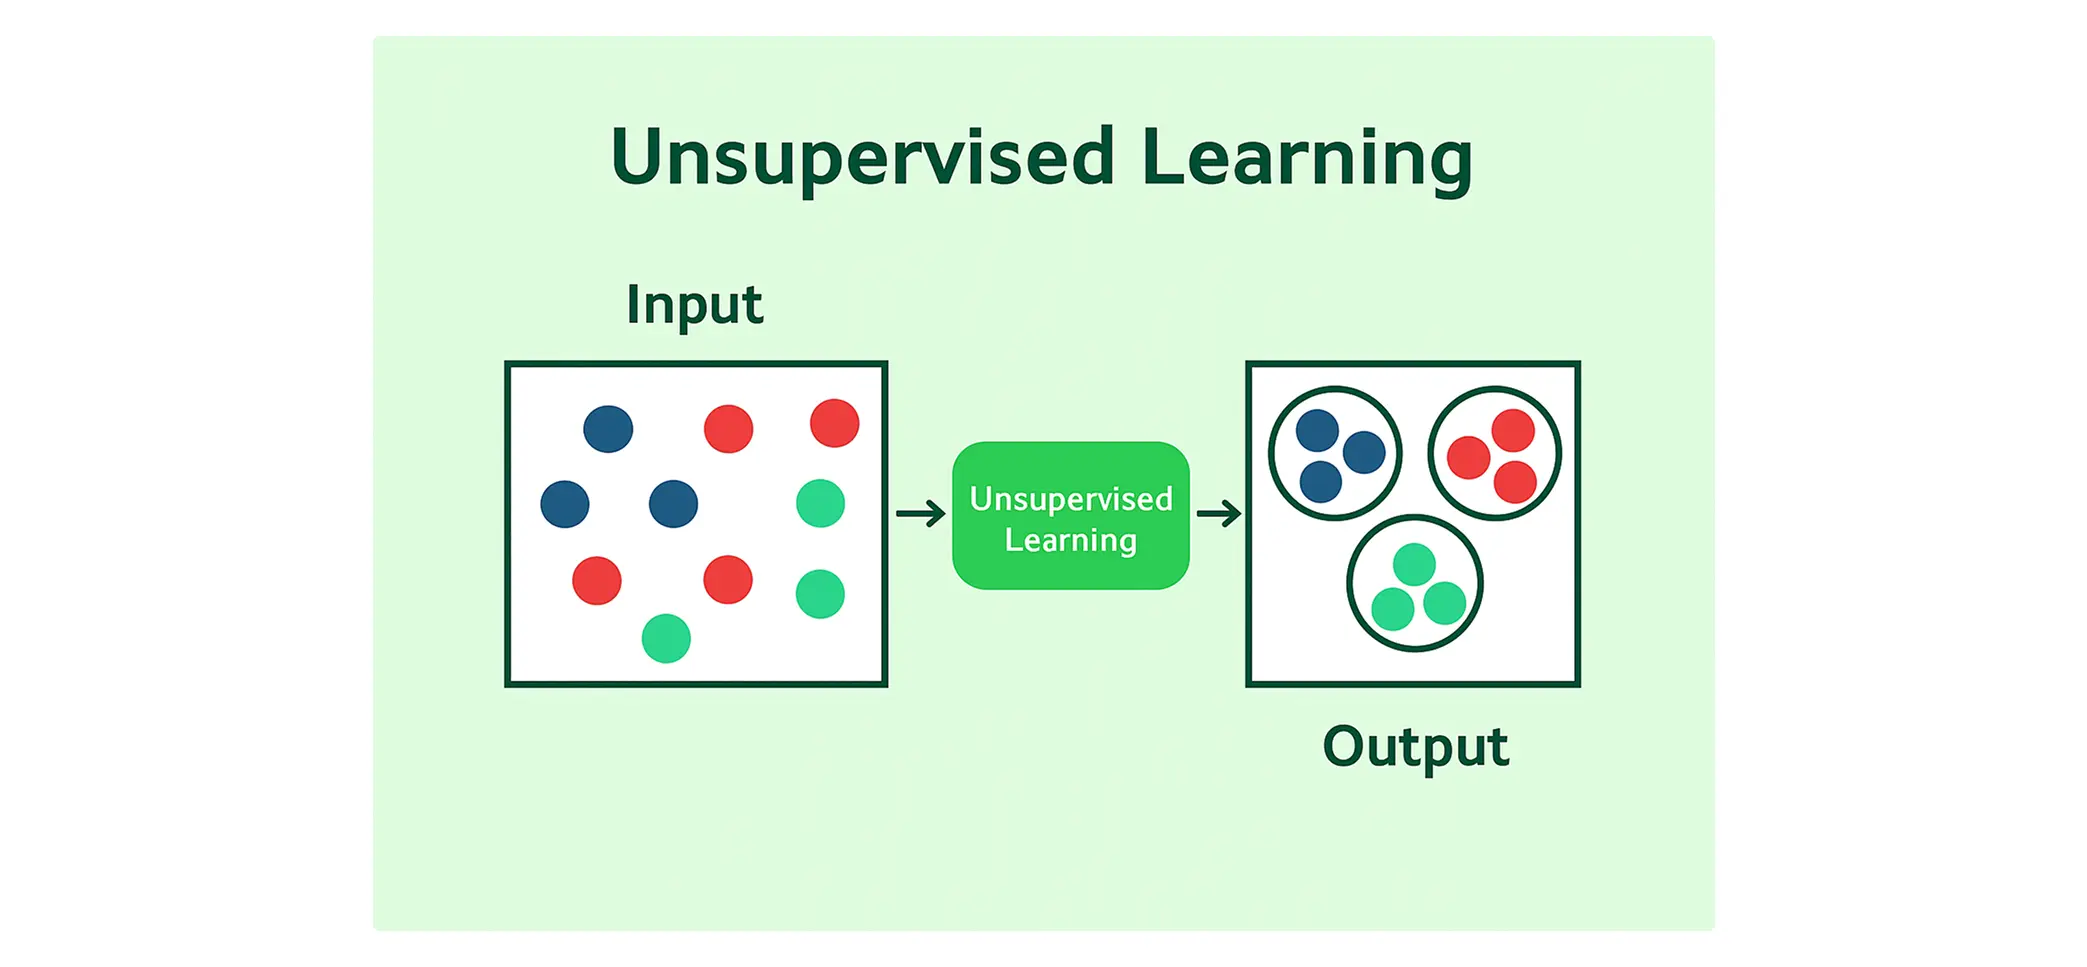
Hierarchical clustering is used to create a tree-like structure of groups based on similarity, making it a perfect fit for exploratory data analysis. It’s particularly useful when you don’t know the number of clusters beforehand.
Keep in mind that the choice of linkage criteria and distance metric can significantly affect the results.
The Apriori algorithm is commonly used for market basket analysis to uncover relationships between items, like which products are frequently bought together. It’s most useful on transactional datasets with a well-defined structure.
When using Apriori, make sure that the minimum support and confidence thresholds are set appropriately to avoid overwhelming results. Association rule algorithms like Apriori are used by e-commerce companies like Amazon.
Principal Component Analysis (PCA) reduces the dimensionality of large datasets, making it easier to visualize and understand the data. It’s best for machine learning processes where you need to simplify data without losing much information.
When applying PCA, normalize the data first and choose the number of components based on the explained variance. This is how biometric authentication, like Facial Recognition, works.
Singular Value Decomposition (SVD) is widely used in recommendation systems and for data compression. It works well with large, sparse matrices, like user-item interactions. When using SVD, pay attention to the computational complexity and consider truncating singular values to reduce noise.
K-Means is a straightforward algorithm for dividing data into distinct clusters, best for scenarios where the clusters are spherical and evenly distributed. It requires specifying the number of clusters (K) in advance. To get the best results, standardize the data and run the algorithm multiple times to avoid local minima in the machine learning process.
Fuzzy means clustering is similar to K-Means but allows data points to belong to multiple clusters with varying degrees of membership.
This can be useful when boundaries between clusters are not clear-cut. How so? Well, while using fuzzy means, consider adjusting the fuzziness parameter to achieve meaningful groupings. This kind of clustering is used in detecting tumors.
Partial Least Squares (PLS) is a dimensionality reduction technique often used in regression problems with highly collinear data.
It’s a good option for scenarios where both predictors and responses are multivariate. When using PLS, determine the optimal number of components to balance accuracy and simplicity.
Entrans has worked with 50+ companies including Fortune 500 companies, and is equipped to handle product engineering, data engineering, and product design from the ground up.
Want to implement ML but are working with legacy systems?
Well, we modernize them so you can implement CI/CD and ML frameworks! This way you can make sure that your machine learning process stays ahead and is updated in real-time.
From AI modeling, AI Serving, testing, and even full-stack development, we can handle projects using industry veterans and under NDA for full confidentiality.
Want to know more? Why not reach out for a free consultation call?
Machine learning algorithms improve the accuracy of the medical coding process. By automating the identification of relevant codes from clinical documentation, these algorithms reduce the manual effort required by human coders. This not only speeds up the billing cycle but also minimizes the risk of errors that can lead to claim denials and revenue loss.
The evaluation or testing step in a typical machine learning process involves using the test data to assess the performance of the trained model. During this phase, the model is presented with data it has not seen during training to get an unbiased estimate of its effectiveness.
The primary function of the inference process is to use a trained machine learning model to make predictions on new, unseen data. After a model has been trained on a dataset, it can be deployed to infer outcomes or make decisions in real-world applications.
Amazon SageMaker simplifies the machine learning process by providing a fully managed platform that handles much of the underlying infrastructure and setup. It offers a suite of tools for every stage of the machine learning lifecycle, from data preparation and model building to training and deployment. This allows data scientists and developers to focus on building and refining their models.
Steps in the machine learning process typically include data collection, where relevant data is gathered, followed by data preparation, which involves cleaning and formatting the data. Next is model training, where an algorithm is used to learn from the data, and then model evaluation, where the model's performance is tested. The final step is deployment,
Machine learning plays a major role in the decision-making process of AI agents by allowing them to learn from data and improve their performance over time without being explicitly programmed. By analyzing vast amounts of data, machine learning algorithms can identify patterns and make predictions that guide the agent's actions
In a machine learning process, data is typically split into a training set and a testing set, with a common split being 80% for training and 20% for testing. The training set is used to teach the model, while the testing set is used to evaluate its performance on unseen data.
The first step in the machine learning process is data collection. This involves gathering relevant data from various sources that will be used to train and test the machine learning model. The quality and quantity of the data collected affect the performance and accuracy of the model.
Machine learning implementation in financial institutions often focuses on tasks like fraud detection, risk assessment, and algorithmic trading. By analyzing large volumes of transactional data, machine learning models can identify unusual patterns that may indicate fraudulent activity, helping to prevent financial losses. Additionally, these models are used to assess credit risk for loan applications.
In manufacturing, machine learning is implemented to optimize production processes, improve quality control, and enable predictive maintenance. By analyzing data from sensors on machinery, machine learning models can predict when equipment is likely to fail, allowing for maintenance to be scheduled proactively to prevent costly downtime. These models also help in identifying defects in products on the assembly in and predicting product demand.