AI data quality monitoring using machine learning anomaly detection for modern data pipelines. Prevent data downtime and protect BI and GenAI systems.


As more people move towards advanced analytics, real-time business intelligence (BI), and generative artificial intelligence (GenAI).
Maintaining the quality of data pipelines takes top priority.
Why is this a challenge? Well, the amount, speed, and variety of data come from many different places.
Meaning, these sources range from high-frequency IoT sensors and legacy on-premises mainframes to third-party APIs.
This can create a mix of data sets and a setting that causes miscalculations that stem from anomalies.
But Luckily, adding artificial intelligence (AI) and machine learning (ML) for automated data quality monitoring can stop this - and here’s how to do that.
The need to use AI-driven data quality monitoring comes from two things. First, the work is getting harder. Second, processing bad or corrupted data costs a lot of money.
In the current data ecosystem, engineering teams spend a lot of money and time fixing pipeline failures. Data quality monitoring using AI could fix these issues before they start.

Machine learning processes can help find data anomalies by changing the way work gets done. They move from deterministic rule enforcement to probabilistic pattern recognition.
Using Data quality monitoring lets systems find the unknown unknowns. These are small changes that a human engineer would never think to write a rule to catch.
These are basic density-based algorithms used to check how close data points are. KNN makes guesses based only on the data points that are closest in the feature space. LOF works in a different way.
LOF looks at local density deviations to flag points that are very far from their groups.
A data point might be in a place where the density of neighbors is much lower than the density around those neighbors. If so, LOF flags it as an anomaly. Data quality monitoring using LOF works well for point anomaly detection in batch-processed datasets.
This fast, tree-based unsupervised algorithm works on the idea that anomalies are few and different.
Using Isolation Forest algorithms separates anomalies by picking a random feature. Then it picks a random split value between the maximum and minimum values of that feature to divide the data.
Anomalous data points lie further away from the dense clusters of normal data. So, they need far fewer random partitions to get separated into their own leaf node.
This mathematical trait makes Isolation Forests work well for high-dimensional tabular data. Data quality monitoring using isolation forests also allows for fast execution in real-time streaming pipelines.
People use this method to map incoming pipeline data into a high-dimensional feature space. It builds a tight hyper-sphere or boundary that holds most of the normal training data.
In this system of data quality monitoring, any new data point that falls outside this mathematical boundary during pipeline execution is marked as an anomaly right away.
SVMs are good in theory. However, they can cost a lot to retrain when dealing with huge datasets that show continuous concept drift.
Autoencoders are specialized artificial neural networks designed to compress input data into a lower-dimensional latent space.
They then try to build the original input back from this compressed form. The ML model for data quality monitoring is trained only on normal, healthy pipeline data.
When anomalous or structurally shifted data goes through the network, the model struggles to compress and build it back correctly. This causes a high reconstruction error. A set dynamic threshold on this error flags the anomaly right away.
Traditional neural networks lack memory. This makes them bad for analyzing sequential data where the current state depends on the previous state.
LSTMs are specialized recurrent neural networks with internal gating mechanisms. They keep temporal context over long sequences. In hard tests monitoring volatile datasets, such as historical air quality sensor networks, LSTM models beat baseline models.
This ML model for data quality monitoring does this by correctly guessing the next expected value in a temporal sequence and flagging big changes.
The most advanced enterprise observability platforms are moving fast beyond isolated, standalone ML models toward Agentic AI architectures.
In this way, AI agents carry out data quality monitoring on their own, checking metadata of the enterprise data ecosystem autonomously. They learn historical patterns and seasonal behaviors without needing any manual setup.
They assess the importance of a table based on its downstream lineage and query execution frequency. Then they give higher compute resources to scan high-impact tables.
Adding machine learning-based anomaly detection is not just about buying a software license. It needs a plan. Anomaly detection must be part of the data lifecycle.
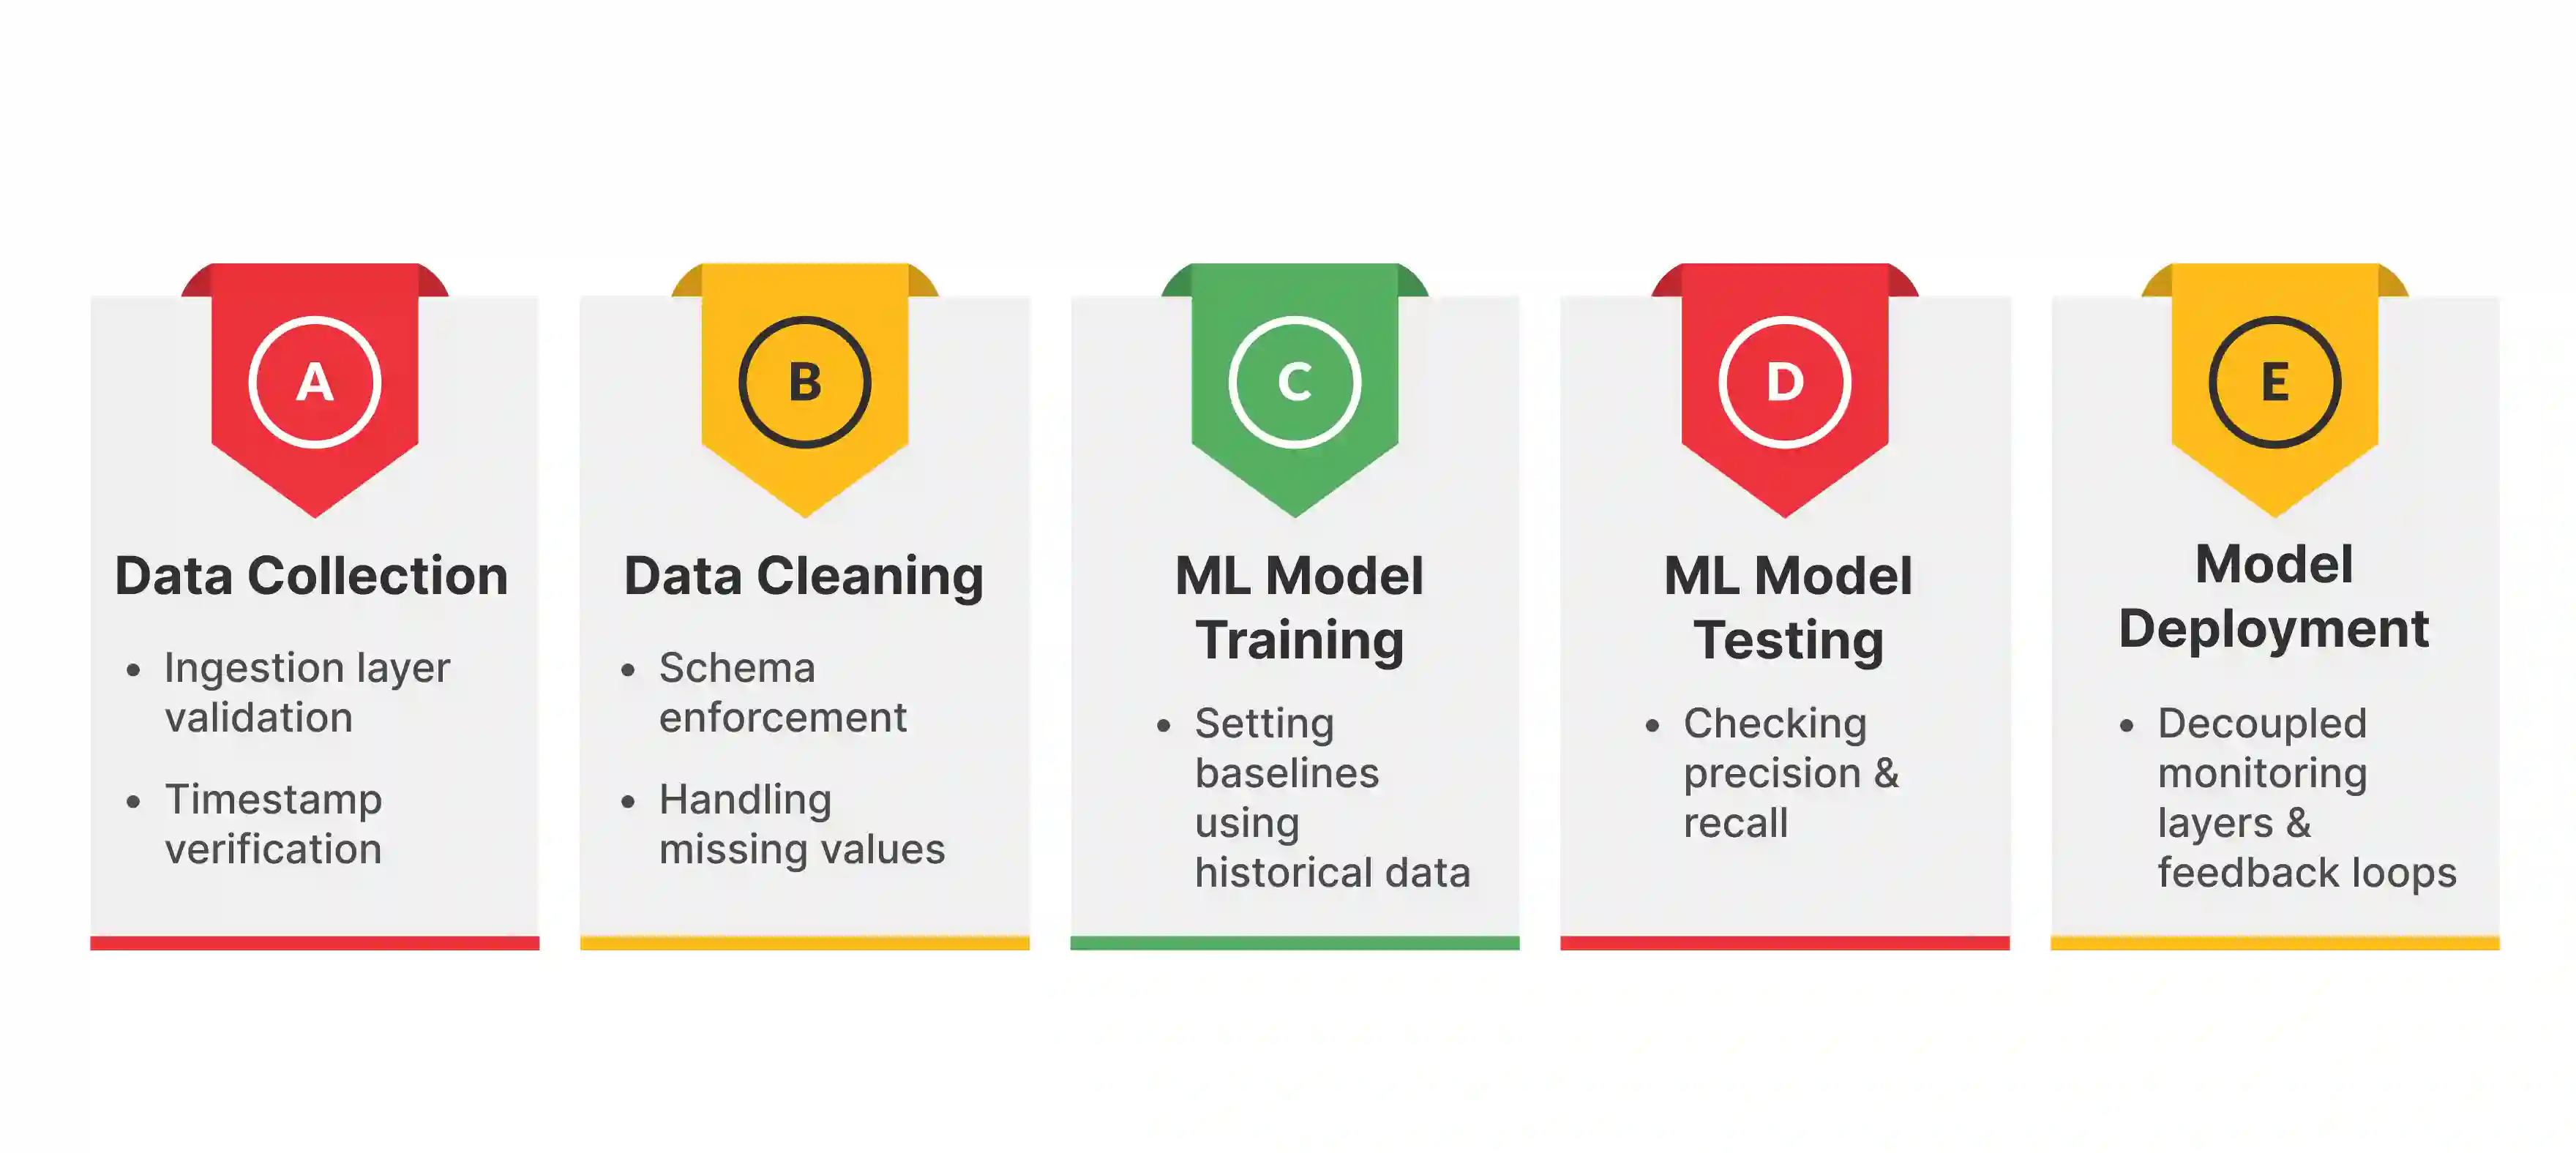
The first step in the AI data quality monitoring process, data collection, is main for setting a trustworthy baseline.
This step involves gathering diverse and relevant datasets from structured and unstructured sources, such as IoT sensors, APIs, and legacy mainframes. This covers major variables.
In this step, data engineering teams must use strict, deterministic pre-processing at the ingestion edge. The old engineering saying Garbage In, Garbage Out applies here. If an ML monitor takes in noisy or malformed data, it will mark later noise as the normal operational baseline.
Data cleaning refines raw datasets to stop model corruption. This involves handling missing values, removing outliers, and fixing format issues.
Also, modern data companies set programmatic data contracts in this phase. These code-based agreements between data producers and consumers define strict rules for schema, data types, and nullability rules.
With methods such as automated schema validation and duplication removal, data cleaning helps downstream ML models work better for more accurate AI data quality monitoring.
Training teaches the model to find patterns and relationships in the data to set a normal behavioral distribution.
This step in AI for data quality monitoring uses ML algorithms and mathematical processes to help the model learn from historical examples. It is where the real work begins in anomaly detection.
Because anomalies are often unknown unknowns, training usually focuses on unsupervised learning. The model learns the shape and density of valid data rather than being told what an error looks like.
Testing checks how well the model works on new data. It is mainly for stopping alert fatigue, in this sense, this step in building your ML data quality monitoring framework is like a dress rehearsal.
It makes sure the model can tell the difference between a harmless data spike (like Black Friday traffic) and a DDoS attack. It helps find hypersensitivity issues before launch.
Because anomalies are rare (imbalanced datasets), traditional accuracy metrics are often wrong. A model that always predicts normal might be 99% accurate but 100% useless.
Deployment is the final step. The model moves from testing to real-time observability. It starts making predictions or decisions based on new data.
This step in creating an AI powered data quality monitoring system connects the model to users or systems that need its outputs. This often happens via a decoupled monitoring layer.
Best practices say that the monitoring layer should sit above the pipeline. It checks metadata asynchronously. It should not be inside the ETL code where it could cause bottlenecks.
A point anomaly happens when a single, individual data instance is very weird compared to the rest of the dataset.
In an industrial IoT pipeline, a sensor might suddenly report an operating temperature of 500°C when the historical operational maximum is a strict 80°C. This is a point anomaly.
If a single point anomaly gets into a data warehouse, it can change the averages used in downstream predictive pricing algorithms - which is just one of the reasons using AI for data quality monitoring is so essential.
Contextual anomalies are harder to find. The raw data value looks normal on its own. It is only an anomaly when checked within a specific context. This is usually defined by time or space parameters.
For example, a huge spike in e-commerce web traffic with 10,000 requests per minute is normal during a Black Friday sales event. But it might be a DDoS attack if it happens at 3:00 AM on a random Tuesday.
Advanced algorithms can use seasonality and external event calendars to move acceptable threshold boundaries in real-time.
A collective anomaly happens when a specific group or sequence of data points looks wrong only when viewed together. Individually, each data point looks fine.
A classic pipeline example is a slow but steady drop in the cardinality (uniqueness) of a specific database column.
If a status column historically holds 5 distinct values and slowly changes to only holding 2, the collective group clearly shows an upstream application logic failure.
Upstream software developers often rename columns, change core data types (e.g., changing a ZIP code from an Integer to a String), or drop fields entirely without telling the downstream data team.
This silent drift breaks downstream transformation logic and in doing this, causes major pipeline ingestion failures.
While the benefits of data quality monitoring using AI are HUGE, the reality of setting up these systems is full of technical friction.
The biggest challenge in creating a ML powered data quality monitoring system is algorithmic hypersensitivity. This causes bad alert fatigue. ML models often struggle to tell the difference between organic business fluctuations and real errors.
ML anomaly detection models for data quality monitoring need clean historical data to set correct baselines.
A big debate exists regarding where ML detection should live. Putting compute-intensive ML models directly inside core ETL code lowers throughput and adds latency.
Industry agreement says that anomaly detection must work as an independent, decoupled layer. A Separation of Concerns checks the pipeline exhaust asynchronously and should not work as an inline bottleneck in your AI data quality monitoring framework.
Main domains like fraud detection have imbalanced datasets where anomalies are very rare.
Entrans builds cloud-native data platforms and standardizes pipelines across Azure, AWS, and GCP.
With Fortune 500 companies as well as fast-growing enterprises as clients, Entrans moves companies away from brittle batch jobs toward streaming-first architectures using Apache Spark, Databricks, and Snowflake.
The main difference with Entrans is our Embedded Intelligence method. This puts AI directly into enterprise data flows - this can be done by setting up an AI data quality monitoring system through:
Want to make sure your data infrastructure is AI-ready?
Book a free consultation call with our data engineers to discuss your Data quality monitoring requirements!
Rule-based checks use static thresholds coded by engineers (e.g., alert if value < 100). ML-based detection is probabilistic and autonomous. It learns historical patterns to set dynamic baselines. This lets it find unknown unknowns that rules would miss.
Data quality monitoring should be a layered mechanism. Deterministic data contracts should live at the ingestion edge to block malformed data. Complex ML detection should work as a decoupled monitoring layer sitting atop the data warehouse. It checks metadata asynchronously.
Alert fatigue happens when too many false positives make engineers ignore notifications. Modern platforms fix this by linking multidimensional signals. Instead of firing 100 alerts for 100 dropping metrics, AI groups them into a single contextualized alert. This finds the one root cause.
Deep learning models like LSTMs work well for keeping memory of past states to forecast sequences. For fast, scalable ways, tree-based Isolation Forests or ARIMA-based estimators are often used. They check high-velocity streams without causing bottlenecks.
Yes. Unsupervised learning models like Autoencoders can find malicious data poisoning or unauthorized exfiltration. They identify abnormal query payload sizes or access patterns that mimic legitimate flows but look a bit different.
ML models are mathematical reflections of their training data. If the historical data has errors, the model will take this as the normal baseline. It will fail to flag future corruption. Basic data cleansing is a must.
ROI in investing in a data quality monitoring framework is calculated by measuring the drop in Data Downtime and the lower operational losses. This includes savings on engineering resources used on manual troubleshooting and in doing so, it also stops revenue loss from bad decisions.
Building strong ML detection systems from scratch is a huge task. It needs rare talent. Entrans gives quick access to expert AIOps engineers and proven architectural patterns. This makes sure time-to-value is faster and stops the risk of project failure.