FDE metrics help measure Time-to-Value, deployment success, customer adoption, and ROI. Learn which benchmarks matter for high-performing FDE teams.

Agentic Unconference 2026 - September 19, Chennai
View Event →


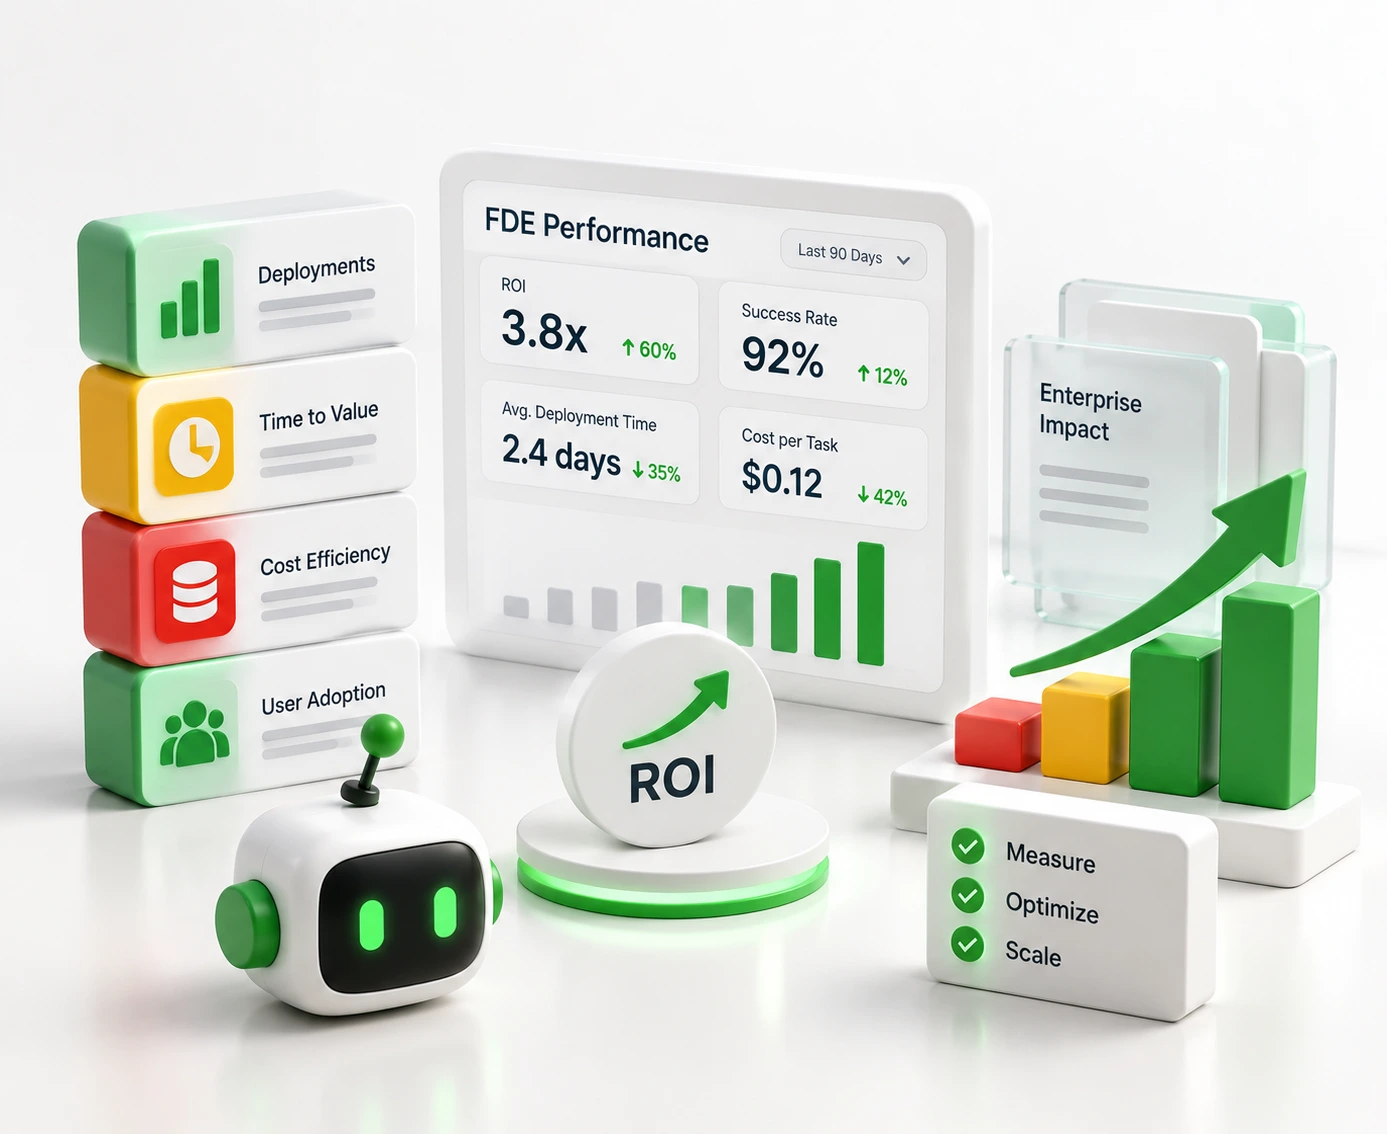


Most enterprise AI projects fail. Not because the technology is bad. But because no one closes the gap between what the platform can do and what the business actually needs.
That is the job of a Forward Deployed Engineer, or FDE.
And it is also why measuring FDE performance is so hard.
These are engineers that write production code, navigate complex customer environments, and feed real-world insights back into the product.
So to help you out, this guide breaks down how to measure FDE performance the right way.
From the framework that connects daily activity to business outcomes, to the exact metrics, benchmarks, and ROI model that are not just vanity metrics for your business.
FDE metrics are the set of measurements used to track whether an FDE team is creating real value. Not just whether they are busy. Not just whether they are shipping code. But whether their work is moving customers from pilot to production and turning that deployment into lasting business impact.
Traditional engineering metrics like lines of code or commit counts reward volume. But an FDE's goal is to solve a customer's problem with the minimum amount of custom code needed. More code is often a sign of a bad solution.
As Dr. Nicole Forsgren argues, measuring developers by code output simply incentivizes bloated software. The same trap applies to FDEs.
FDE ROI metrics must measure something different. They must track whether the engineer's work led to a customer achieving a real outcome in production. That is the only measure that matters.
The most effective way to measure an FDE team is through a four-stage framework. Each stage builds on the one before it. And each one is needed to get the full picture.
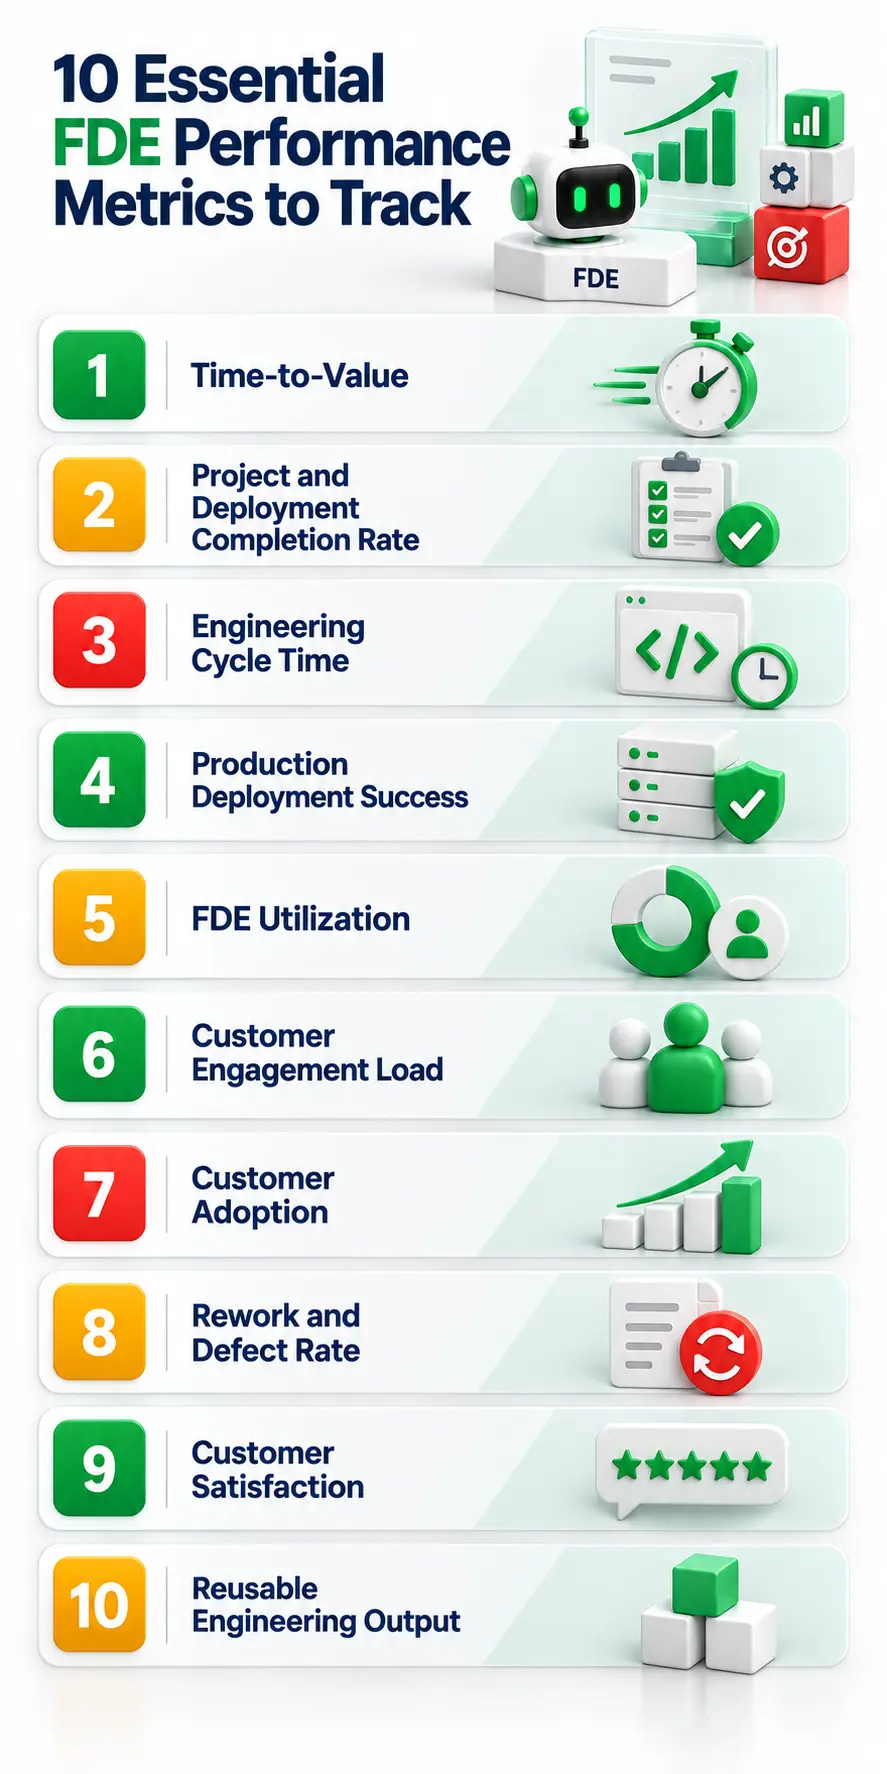
Time-to-Value, or TTV, is an FDE performance metric measures how long it takes from the start of an engagement to the moment the customer achieves their first real operational outcome. This is the anchor metric for FDE performance.
Palantir's AIP Bootcamps show what elite TTV looks like.
FDEs embed with the customer and move them from zero to a live, working use case connected to their own data in one to five days. The enterprise SaaS industry average for TTV is three to six months. The FDE target is one to fourteen days.
But TTV must be measured carefully. Rushing fragile, non-scalable code to hit a TTV target creates technical debt that collapses the deployment later. Speed without quality is not a win.
This measures the percentage of FDE-led pilots that reach full, live production. Not the ones that stall at the proof-of-concept stage. The ones that cross the finish line.
The RAND Corporation has found that AI project failure rates are roughly twice those of standard IT projects.
Most of those failures happen at the scale-up stage. The FDE's job is to navigate the organizational roadblocks, legacy data problems, and technical limits that stop pilots from becoming production systems. A target of greater than 80% conversion from pilot to production is a reasonable benchmark.
The risk with this FDE performance metric is cherry-picking. If FDE teams are evaluated only on completion rates, they may avoid taking on difficult, high-impact engagements to protect their numbers.
Engineering Cycle Time tracks how long it takes an FDE to move a customer-specific feature or integration from initial request to live production. Fast cycle times show technical agility. They show the FDE can iterate against real enterprise data without getting stuck in slow approval chains.
DORA research shows that elite engineering teams measure cycle times in hours or days, not weeks. That is the target for FDE teams too. But speed without governance creates a different problem. FDEs who skip security reviews or testing to hit cycle time targets end up shipping unstable systems that damage the customer relationship.
This tracks the reliability of what the FDE ships once it is live. Also called the inverse of the change failure rate, this FDE performance metric measures how often a deployment causes a production incident or requires an emergency rollback.
A failure in production does not just create a support ticket - It also destroys the trust needed to keep the account.
DORA benchmarks show elite engineering teams maintain a change failure rate between 0% and 15%. That is the proxy target for FDE deployment work.
Utilization tracks the share of an FDE's working hours spent on customer-facing deployment or customer-specific engineering. It matters for capacity planning. But it is one of the most misused performance metrics in the FDE function.
TSIA data puts the standard billable utilization target for professional services at 75% to 85%. Applied to FDEs, that target is actively harmful.
FDEs need time to write documentation, build reusable assets, and share field observations with the product team. A fully utilized FDE has none of that time. The FDE-specific target is 60% to 75% customer-facing time, with the remaining 25% to 40% reserved for internal R&D work.
This measures how many active enterprise customers or major deployments a single FDE handles at the same time. FDEs need deep context about each customer's technical setup, data structure, and business domain. Spread too thin, that context disappears. The FDE becomes a reactive support agent instead of a proactive deployment partner.
There is no universal benchmark for this. The right number depends on the complexity of each deployment. In practice, the range is typically one to three concurrent engagements per FDE.
Adoption measures whether the customer's own people are actually using what the FDE built - FDEs are accountable for operational value, not just functional code.
When OpenAI deployed GPT-4 with Morgan Stanley, the measure of success was not API uptime. It was whether financial advisors were using the AI assistant in their daily work. High adoption validates that the FDE understood the real business problem and built something that fit into the actual workflow.
Research shows high adoption correlates with 19% faster TTV and stronger net revenue retention.
Rework rate tracks how much of an FDE's time goes back into fixing bugs or reworking earlier implementations.
Some rework is normal in fast-moving deployments. Too much is a signal that the initial scoping was poor, the data structures were misunderstood, or the coding discipline was weak.
A rework rate above 20% of total engineering hours points to a systemic quality problem. That level of rework also destroys capacity. Time spent fixing old work is time not spent moving other customers forward.
CSAT and Net Promoter Score measure how much the customer values the FDE's technical skill and partnership. FDEs often work in politically charged environments. Government agencies. Legacy manufacturers. Regulated financial institutions. In those settings, trust is the product as much as the software is.
High CSAT creates internal champions who push the technology forward inside the organization and remove friction from future expansion.
The risk is becoming a yes-person. An FDE who chases high CSAT scores may agree to build heavily customized, non-scalable features that satisfy one vocal client but violate the core product architecture.
This measures how much of the work done for one customer gets abstracted into assets that can be used across future customers.
This is one of the things that most clearly separates an FDE from a traditional consultant. Every FDE engagement should act as funded R&D for the core product.
Databricks Field Engineering does this well. Engineers build Solution Accelerators based on common field patterns, such as processing OEE data in manufacturing, and scale them across multiple clients. This cuts Time-to-Value for future deployments and generates compounding value from a single engagement.
The DORA framework, developed by Jez Humble, Gene Kim, and Dr. Nicole Forsgren, gives engineering teams four core metrics. Deployment frequency. Lead time for changes. Mean time to recovery. Change failure rate.
These were designed for product engineering teams. But they translate directly to FDE work with one key adjustment. The scope is the customer deployment environment, not the internal codebase.
What does not translate is code volume. Measuring FDE productivity by lines of code or commit frequency is one of the most damaging mistakes a team can make.
An FDE evaluated on code output will avoid using existing platform features to inflate their numbers. The result is unnecessary custom code, higher technical debt for the customer, and a deployment that is harder to maintain.
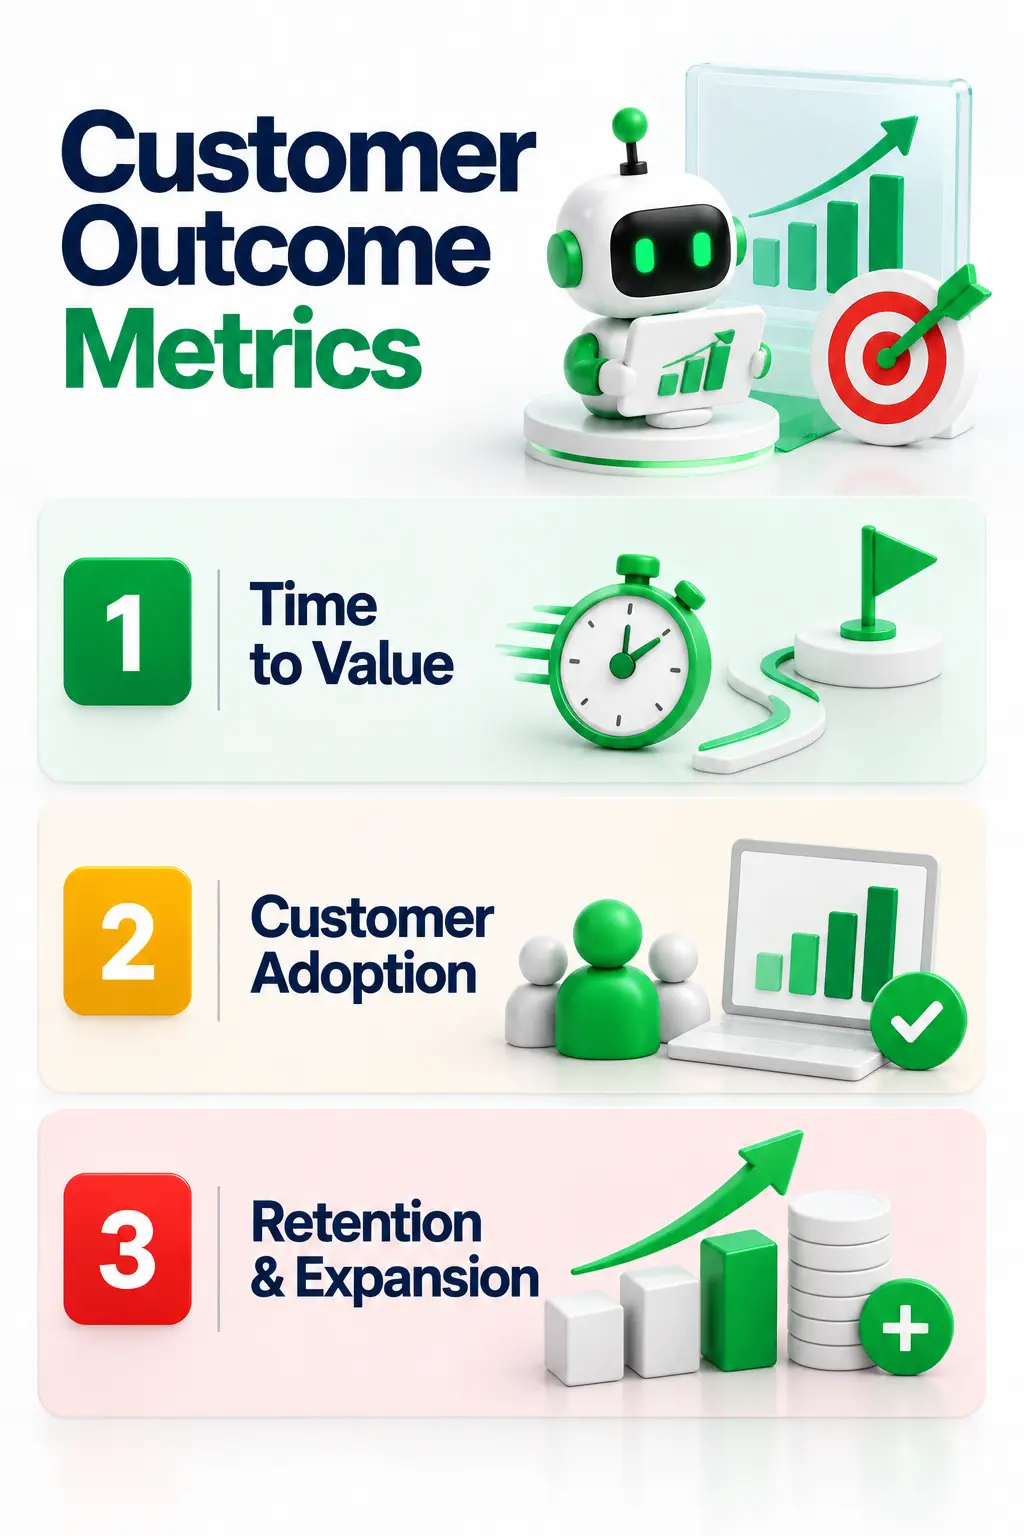
Time-to-Value is an FDE performance metric that tracks is a the gap between kickoff and first measurable outcome.
Time-to-Production tracks the gap between kickoff and full live deployment.
Both matter! A fast TTV that never reaches production is a stalled pilot. A slow TTV that eventually reaches production may have already lost the executive sponsor.
The goal is to compress both. Not by cutting corners. But by having the technical depth to move fast on a solid foundation.
Adoption is measured by the ratio of active daily or weekly users to the total number of provisioned users. A deployment with 20% adoption is not a success, no matter how clean the code is.
FDEs who track adoption rates can spot early warning signs. If adoption is low, the problem is usually one of three things. The tool does not fit the actual workflow. The interface is too complex. Or the rollout lacked proper change management.
McKinsey research shows that Time-to-Value is one of the strongest drivers of net revenue retention in B2B technology. Customers who reach value fast are more likely to renew and expand.
FDEs who accelerate production deployments directly improve NRR. That is a financial outcome tied to a technical action. And it is one of the clearest ways to justify the cost of the FDE function to a CFO.
A balanced scorecard is the most practical way to track FDE performance without creating bad incentives. The key word is balanced. Optimizing any single metric in isolation will damage the others.
This is where most FDE measurement programs break down. A metric becomes a target. The target starts driving behavior.
And the behavior starts damaging the outcome the metric was designed to track. This is Goodhart's Law. When a measure becomes a target, it stops being a good measure.
Three metrics in particular create severe problems when used as hard targets.
The benchmarks that matter most for FDE teams are the following.
Building a high-performing FDE function from scratch is one of the hardest talent challenges in enterprise technology right now. The role requires production-grade software engineering, applied AI architecture knowledge, and the ability to navigate complex customer environments.
Entrans solves this by operating as a forward-deployed engineering partner. Our FDE engineers embed directly inside your customer delivery teams and work to the same standards as an internal FDE function.
If your team is trying to measure and improve FDE performance, or if you are evaluating whether an embedded engineering partner makes sense for your AI deployment program, talk to the Entrans team.
Book a consultation call with our FDE team to see how we apply it in practice.

A Forward Deployed Engineer is a hybrid role that combines production-grade software engineering with technical consulting and customer success. FDEs embed directly with enterprise customers to close the gap between what an AI or data platform can do and what the customer's operations actually need.
Time-to-Value is the most important single metric for FDE performance. Short TTV shows that the FDE can move a customer from concept to working production system fast. That speed is what prevents pilot stagnation and builds the executive trust needed for long-term expansion.
FDE utilization is measured as customer-facing hours divided by total available working hours. But the target should not mirror the professional services standard of 75% to 85%. FDEs need 25% to 40% of their time for internal work. Documentation, reusable asset creation, and product feedback.
FDE ROI is calculated by adding up the total value the FDE created, subtracting the total cost of the FDE, dividing by the cost, and multiplying by 100. The value side includes influenced ARR, churn prevented, expansion ARR from new use cases found on-site, and the long-term value of reusable IP.

-1.svg)